Flow Path Analysis
LiveNX provides detailed end-to-end traffic performance using standard Flexible NetFlow packets, general MIB information and the LiveNX alerts. The Flow Path Analysis, Medianet Flow Path Analysis and Application Visibility and Control (AVC) Flow Path Analysis features combine this information into a single table that can be used to troubleshoot problems on the network using a specific flow. This feature is accessible from the tables and topologies in the flow system, device, and historical playback views, as well as the Top Analysis report. Flow alerts and performance measurements statistics are provided on a per hop basis. The following steps show how to access the Flow Path Analysis through the flow system topology view.
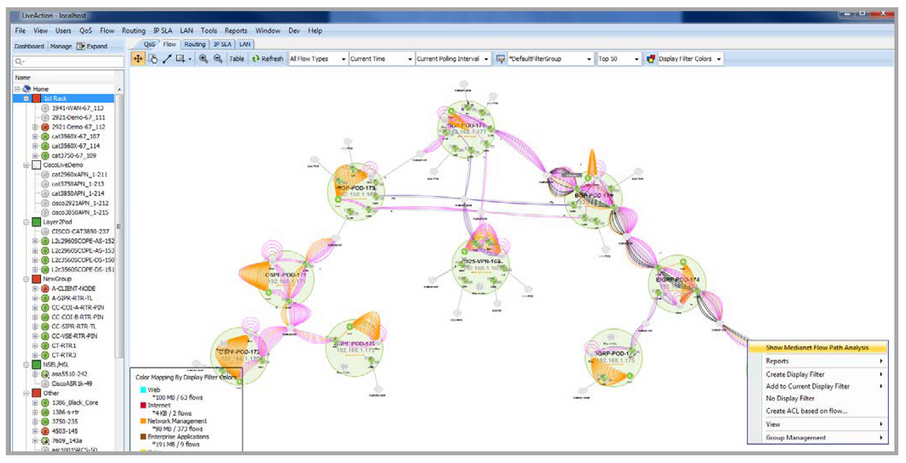
• Step 1: Go to the Flow tab in the System Topology View
• Step 2: Filter for either Basic Flows, Medianet flows or AVC flows
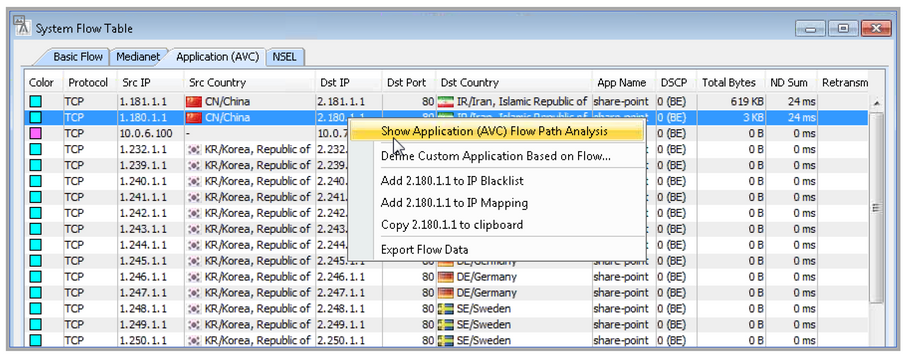
• Step 3: Right click on the flow of interest and select Show Flow Path Analysis, Show Medianet Flow Path Analysis or Show AVC Flow Path Analysis
The first two examples show access to the Flow and the Medianet Flow Path Analysis through the system topology. The third example shows access to the AVC Flow Path Analysis through the AVC tab within the System Flow Table.
Evaluate table results
LiveNX identifies the Flow, Medianet or AVC flow across the system based on the 5-tuple (source IP address, destination IP address, protocol, source port and destination port) and the RTP SSRC value.
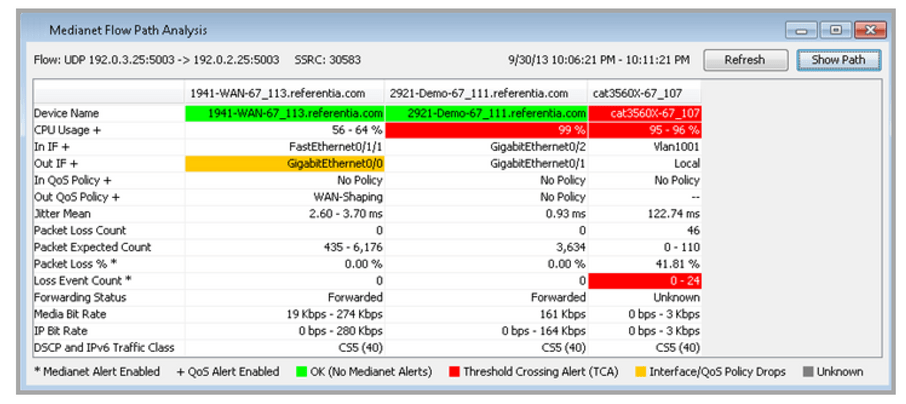
The header information above the table entries describes the flow under analysis listed in order: protocol, source IP address, source port, destination IP address, destination port and SSRC value. The date and time range corresponds to the range of the query period (currently fixed at 5 minutes). Click on Refresh to update the table with the most recent data.
Devices are displayed as column headers from left to right corresponding to the order that the flow traverses through the devices. The ordering of the columns is user-selectable; to reorder the columns, click on the device name in the column header, then click-drag the columns to reorder.
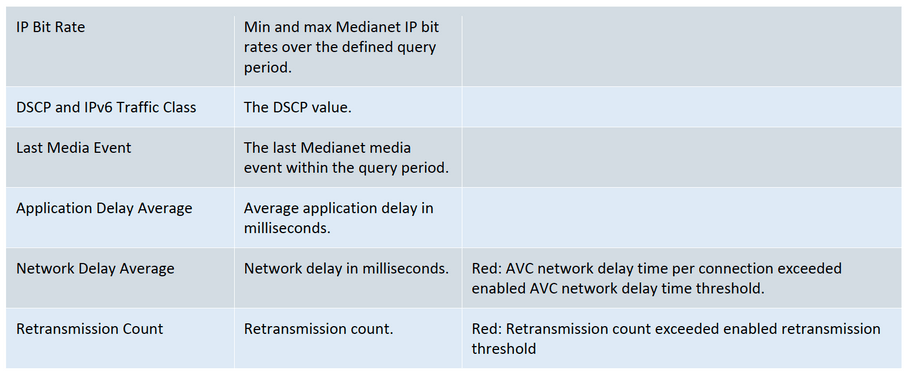
The row headers represent device, interface or performance attributes. Entries within a given row indicate the attribute value at the device shown in the column header. Medianet attributes include Jitter Mean, Packet Loss Count, Packet Expected Count and Packet Loss %; these statistics are not available in the Flow Path Analysis. AVC attributes include Application Delay Average, Network Delay Average and Retransmissions. Red or yellow table entries indicate performance exceeding alert or drop thresholds as defined in Tools > Configure Alerts.
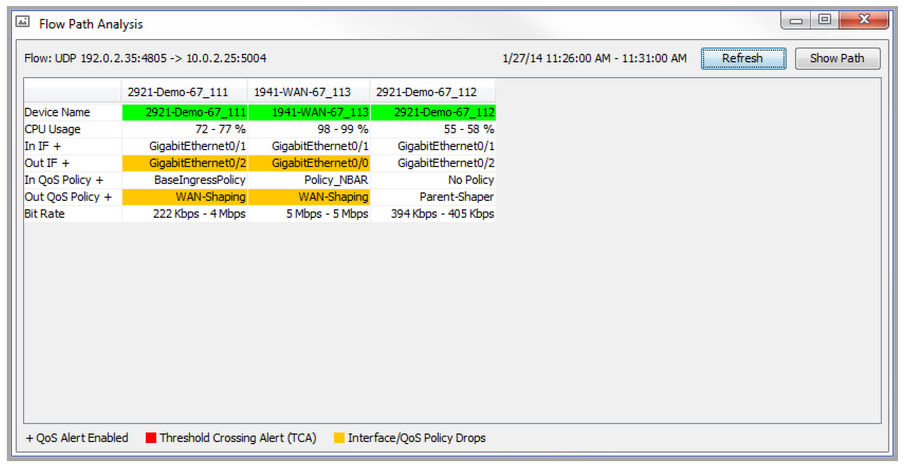
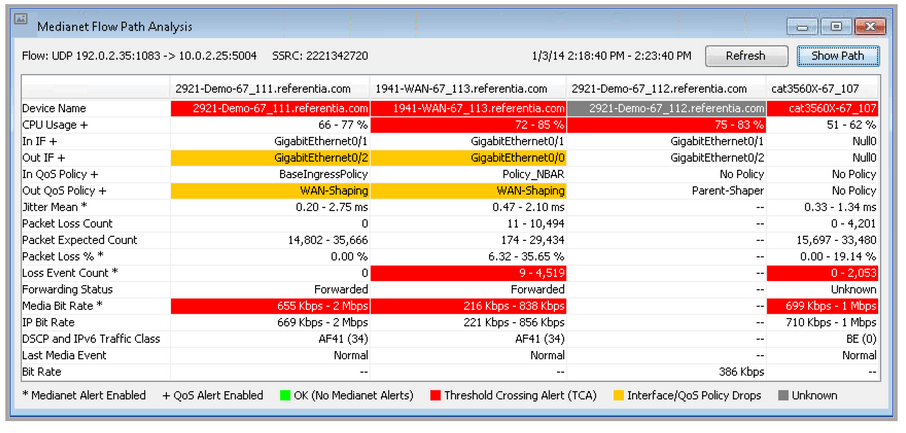
In cases where devices within a given Medianet or AVC flow do not support Medianet or AVC, then the Medianet or AVC related attributes will be blank, as shown in the 2921-Demo-67_112 device column shown below.
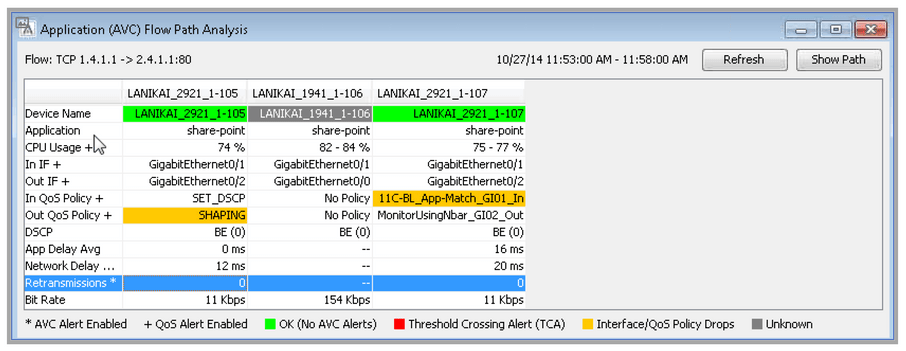
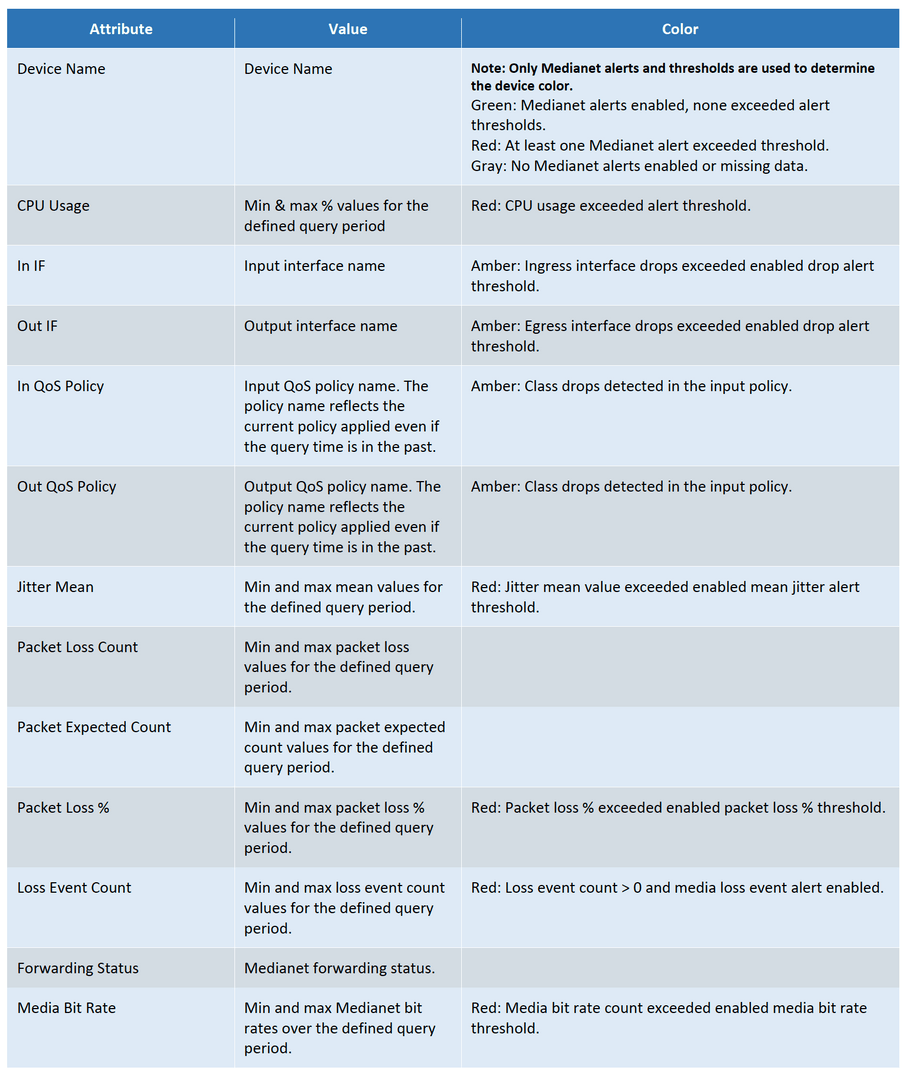
• A “*” is appended to the end of the attribute name if the corresponding Medianet or AVC alert is enabled within LiveNX.
• A “+” is appended to the end of the attribute name if the corresponding Device/QoS alert is enabled within LiveNX.
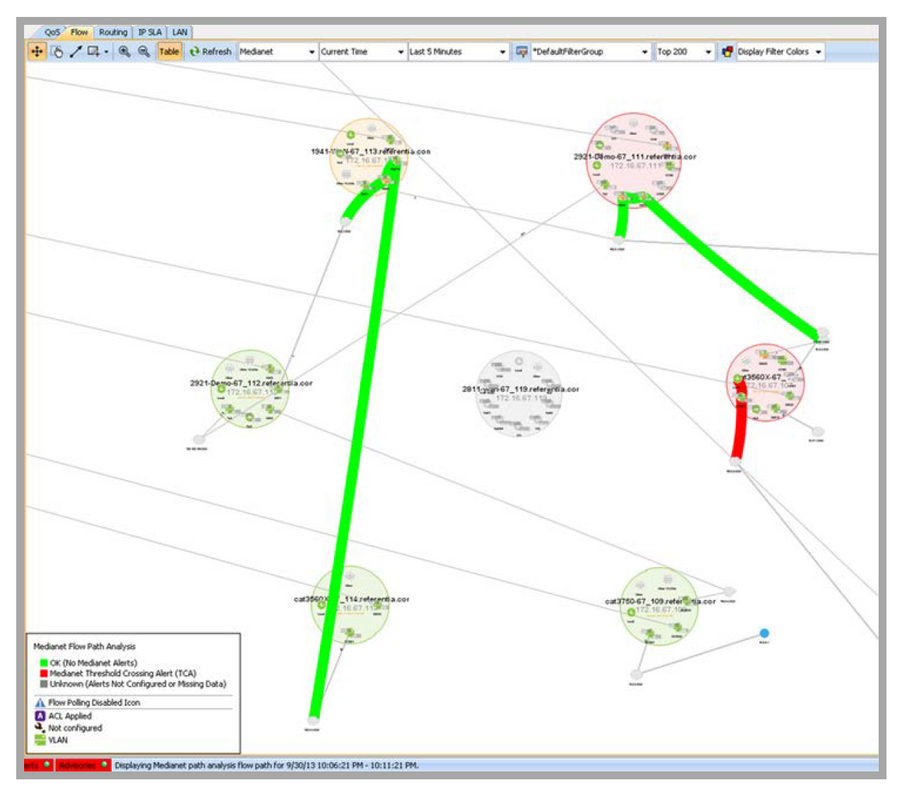
Step 5: Click on Show Path in the Path Analysis Table to visualize and isolate the Flow, Medianet or AVC flow through the system topology
The flow colors correspond to the device colors in the Basic, Medianet or AVC Flow Path Analysis table. After clicking on Show Path, if you click on Refresh, only the Path Analysis table will update; you will need to click Show Path again to reflect the updated path results.
NOTE: Other operations in the flow system view such as changing the filter, refreshing, or merging/unmerging flows will remove the path analysis flow and redraw the system view normally. Click Show Path to redraw the path analysis flow.